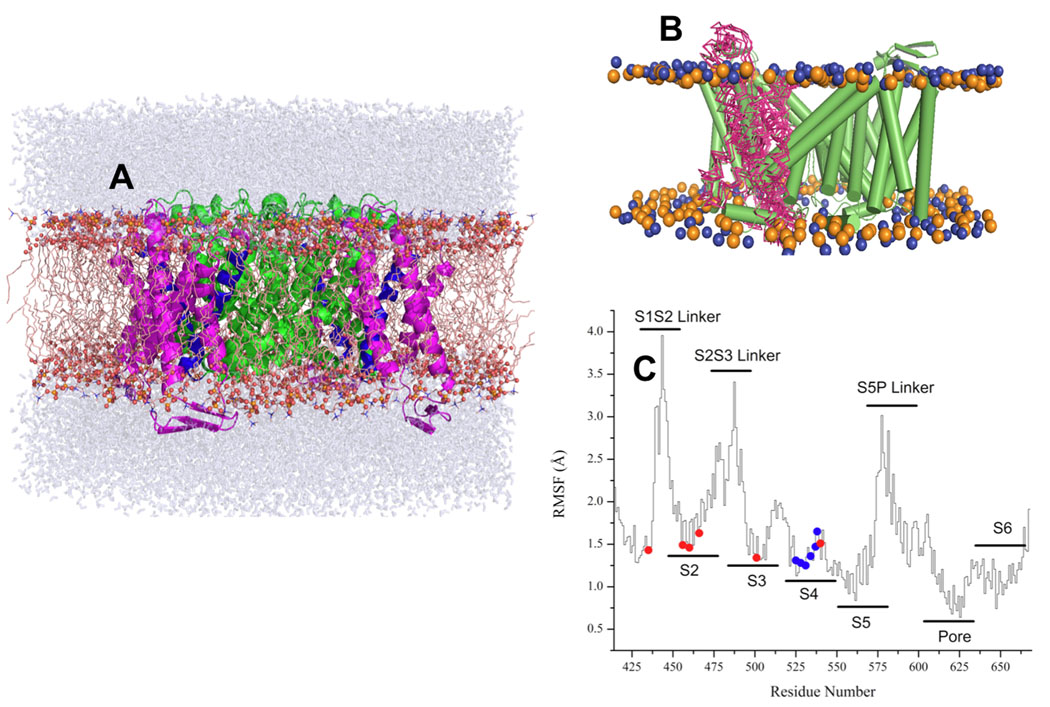
Figure 1. MD simulation setup and RMSD Analysis.
(A) The structure of ROSETTA-TM herg+3 model after 10 ns equilibration. S5–S6 domains are shown in a green color, S4 is blue and S1–S3 is in magenta (B) the lateral fluctuation of positions for S1–S2 segment along the MD trajectory for ROSETTA-Membrane herg+3 model. (C) RMSD scans along MD trajectory for equilibrated ROSETTA-Membrane herg+3 model. The RMS fluctuations (RMSF) for the pore domain and helical elements are around 2 Å, whereas most flexible elements (EC and IC linkers) display larger fluctuations of up to 4 Å from average structure.

