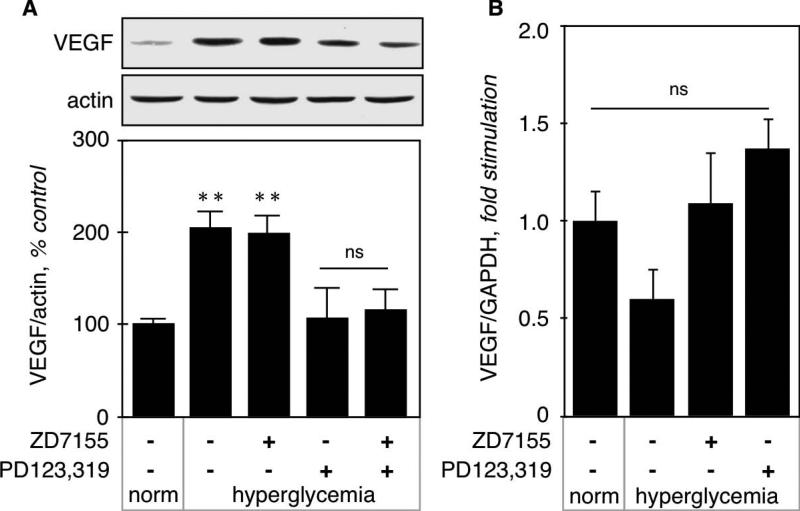
Figure 3. VEGF synthesis in hyperglycemic kidneys.
A. VEGF expression at the protein level was measured on kidney cortex homogenates by immunoblot using a monoclonal antibody directed against VEGF. Actin was used as a loading control. The lower panel shows combined data obtained on kidneys from 5 individual mice for each experimental condition. B. VEGF expression at the mRNA level was measured by RT-qPCR as described in the Methods section. Data was obtained on RNA extracted from kidneys from 5 individual mice for each experimental condition. **p<0.01, ns = not significant by ANOVA.

