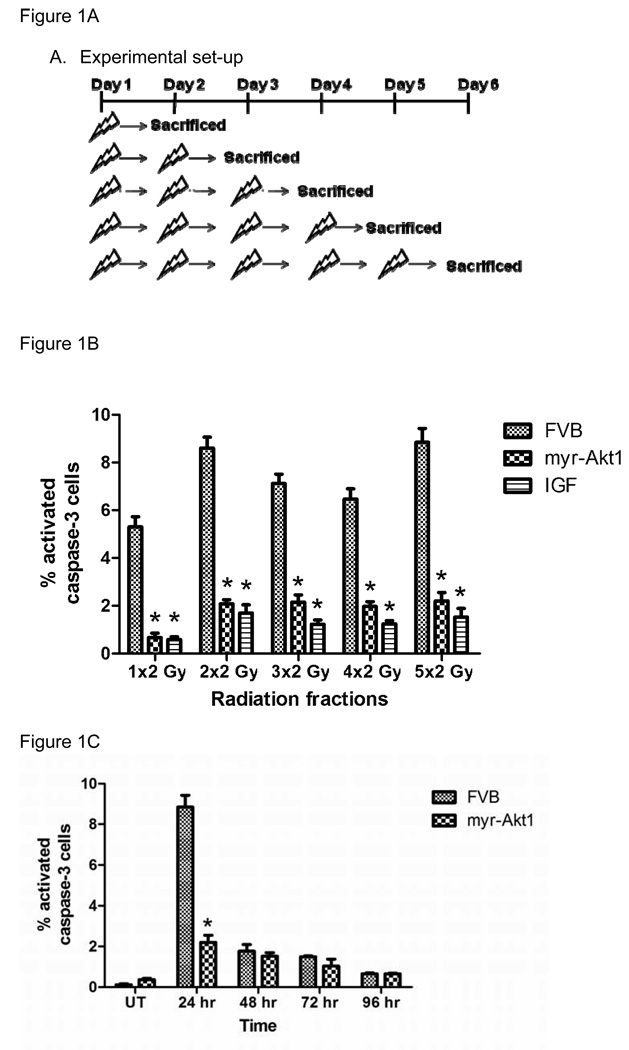
Figure 1. Induction of apoptosis in FVB or myr-Akt1 transgenic mice following 2Gy/day for five consecutive days.
In (A), the experimental set-up for figure 1B is diagramed. In (B), the head and neck region of FVB, myr-Akt1, and FVB mice injected with IGF-1 was exposed to 2 Gy radiation for increasing number of days and the parotid salivary glands were removed 24 hours after the last radiation. Tissues were processed for activated caspase-3 immunohistochemistry as described in the materials and methods section and the number of caspase-3 positive cells is graphed as a percentage of the total number of cells per field of view. In (C), female FVB and myr-Akt1 mice were exposed to 2 Gy radiation per day for five consecutive days as described in (A) and parotid salivary glands were removed at 24, 48, 72, and 96 hours. Tissues were processed for activated caspase-3 immunohistochemistry as described in B. The graph represents all data from three mice per group. Significant differences (p≤0.05) were determined using an ANOVA followed by a pairwise Bonferroni test adjusting for the number of comparisons. (*) indicates significant difference between genotypes of the same treatment.

