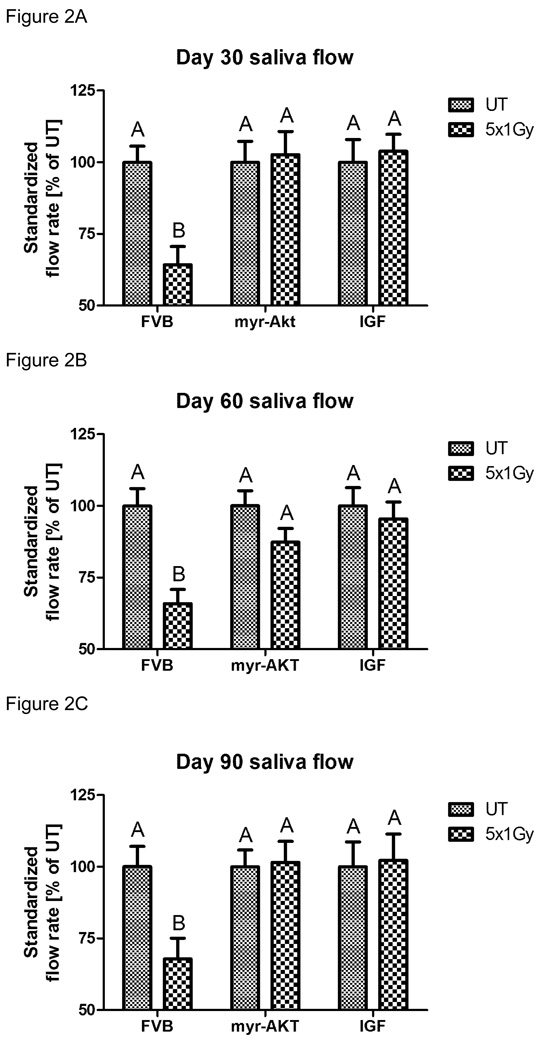
Figure 2. Salivary gland dysfunction in FVB, myr-Akt1 or IGF-1 injected mice following fractionated radiation (1 Gy × 5 days).
The head and neck region of FVB, myr-Akt1, and FVB mice injected with IGF-1 was exposed to 1 Gy radiation per day for five consecutive days and stimulated salivary flow rates were determined as described in the materials and methods section. Irradiated flow rates were normalized to corresponding unirradiated controls on day 30 (A), 60 (B) and 90 (C) after the final radiation treatment. (A) represents all data from at least thirteen mice/group, graph (B) represents all data from at least eleven mice/group, and graph (C) represents all data from at least ten mice/group. Significant differences (p≤0.05) were determined using an ANOVA followed by Student-Newman-Keul’s multiple comparison test. Treatment groups with the same letters are not significantly different from each other.

