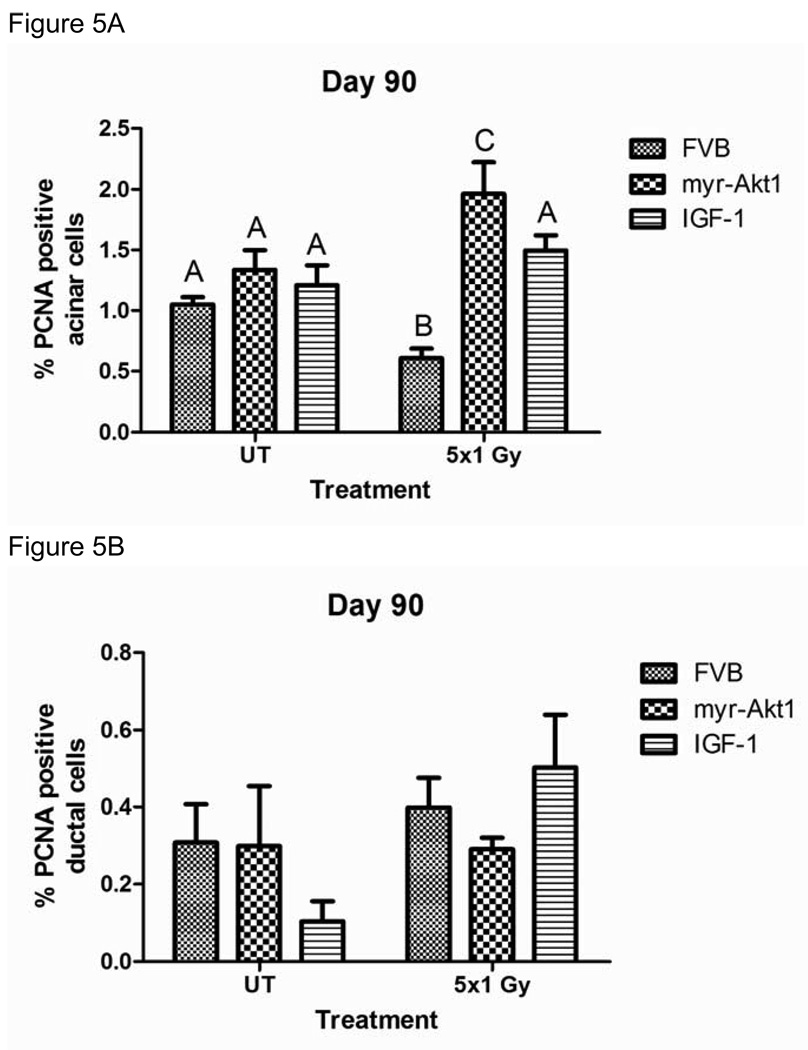
Figure 5. Proliferation of parotid acinar cells following fractionated radiation (1 Gy × 5 days) in FVB, myr-Akt1 or IGF-1 injected mice.
The head and neck region of FVB, myr-Akt1, and FVB mice injected with IGF-1 was exposed to 1 Gy radiation per day for five consecutive days and parotid glands were removed 90 days after the final radiation treatment. Tissues were embedded into paraffin as described in figure 1 and immunohistochemistry was performed using an antibody against PCNA. Graph (A) represents the number of acinar cells with positive PCNA staining as a percentage of the total number of acinar cells in the field of view. Graph (B) represents the number of ductal cells with positive PCNA staining as a percentage of the total number of ductal cells in the field of view. The graph represents all data from at least eight mice per group. Significant differences (p≤0.05) were determined using an ANOVA followed by Student-Newman-Keul’s multiple comparison test. Treatment groups with the same letters are not significantly different from each other.

