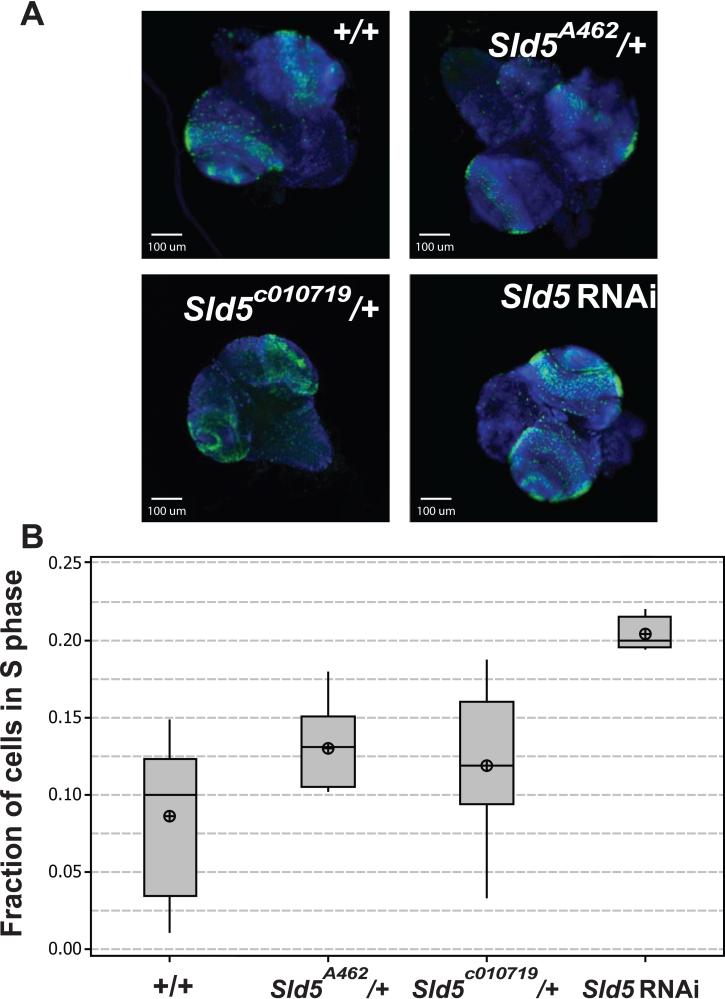
Figure 4. Measurement of S phase indices using EdU incorporation.
A. Micrographs of whole dissected 3rd instar brains showing DNA (blue) and EdU incorporation (green). B. Box plots of S phase indices for the genotypes and RNAi knockdown as indicated. Both the mutant alleles show slight S phase delays while the RNAi treatment shows severe S phase delay.

