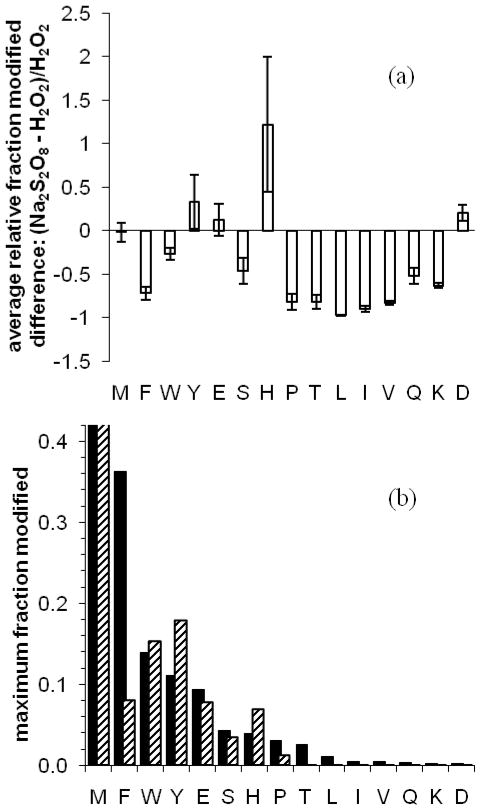
Figure 2.
With (a), the relative difference between persulfate and peroxide fraction modified, of CaM, aMb, bradykinin, and angiotensin II residues, are determined per residue; these values are averaged per amino-acid type. The error bars denote the average pairwise-comparison standard error. In (b) the maximum fraction modified among all same-amino acid residues is plotted. Black bars denote H2O2 FPOP labeling; diagonal-pattern bars denote Na2S2O8 FPOP labeling.

