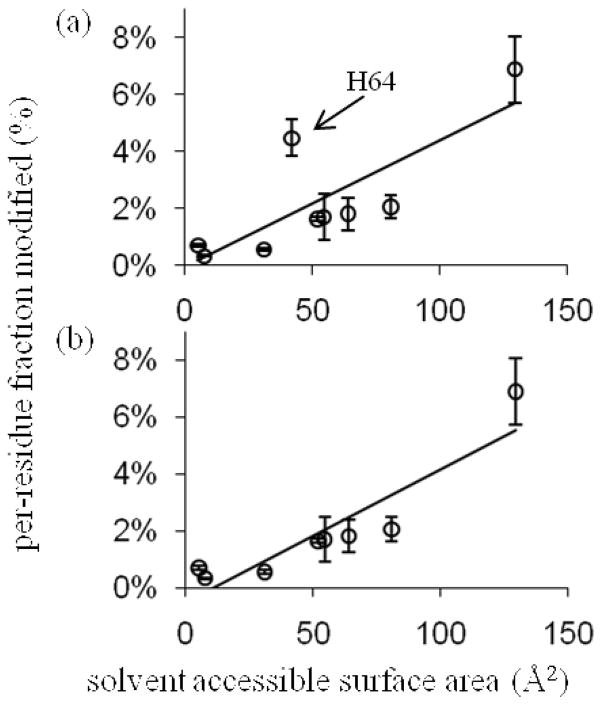
Figure 3.
The modification yields of aMb His residues are plotted against their calculated solvent accessible surface area (SASA), with least-squares straight-line fits shown. In plot (b) the myoglobin His64 was omitted; this improved the R2 fit from 0.63 in (a) to 0.83. The SASA values were calculated from the 1WLA.pdb crystal structure of myoglobin with its heme ignored by the calculator at http://molbio.info.nih.gov/structbio/basic.html, using a 1.4 Å probe.

