
Figure 3.
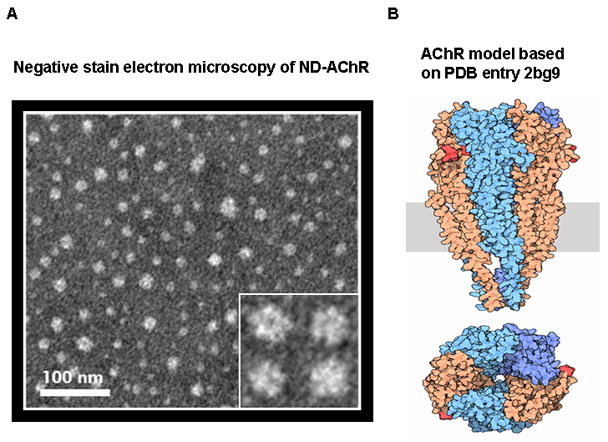
Negative stain electron microscopy of ND-AChR. A. Inset depicts individual particles at 4x magnification which show apparent five-fold symmetry consistent with the known structure of the AChR (B). Diagram of the AChR receptor (Unwin, 2005; reproduced with permission from RCSB PDB: http://dx.doi.org/10.2210/rcsb_pdb/mom_2005_11) for comparison, showing extracellular (above rectangle), transmembrane (rectangle) and intracellular (below rectangle) domains. Bottom figure shows view down the pore axis.