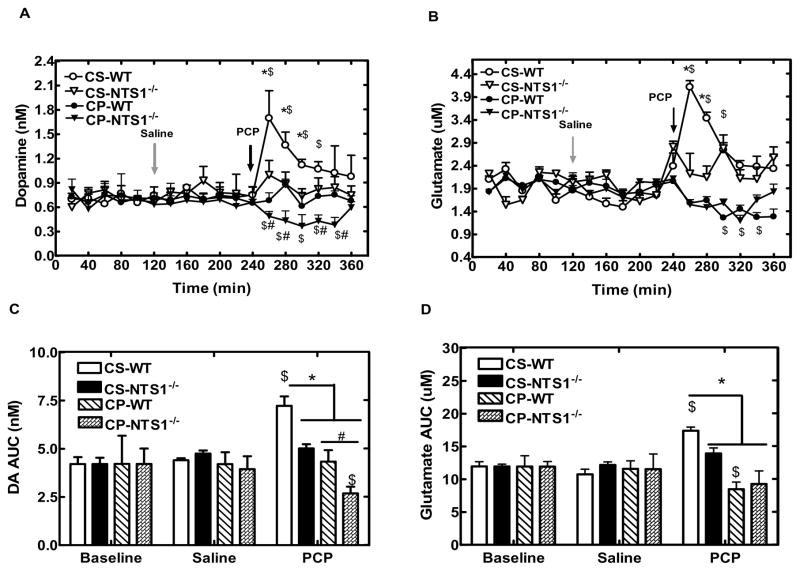
Figure 7.
Effect of chronic PCP or saline injection on DA and glutamate release in mPFC in both WT and NTS1−/− mice. Panel A and C, Effect of chronic PCP or saline injection on DA release in mPFC. The data are shown as real concentration (nM) (± S.E.M) (N=4–7 for each group). Panel B and D, Effect of chronic PCP or saline injection on glutamate release in mPFC. The data are shown as AUC (± S.E.M) (N=4–7 for each group). $, P<0.05, significantly different from saline injection within the group; *, P<0.05, increase vs CS- NTS1−/−, CP-WT and CP- NTS1−/−. #, P<0.05, decrease vs. CP-WT.

