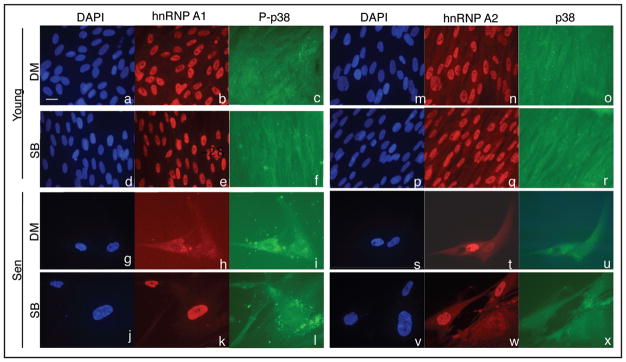
Figure 5.
Effect of p38 MAPK inhibition on the subcellular distribution of hnRNP A1 and A2. Young and senescent IMR-90 cells were treated with 10 μM SB203580 (Parts d–r and j–x) or an equal volume of DMSO (Parts a–o and g–u) for 8 days and then subjected to in situ immunocytochemistry for hnRNP A1, A2, p38 MAPK and phospho-p38 MAPK (P-p38). All fields are shown at a magnification of 400×. Nuclei were identified by DAPI staining. Identical fields were taken for DAPI, hnRNP A1 and P-p38 MAPK, or DAPI, hnRNP A2 and p38 MAPK signals. The scale bar represents 20 μM.

