
Fig. 1.
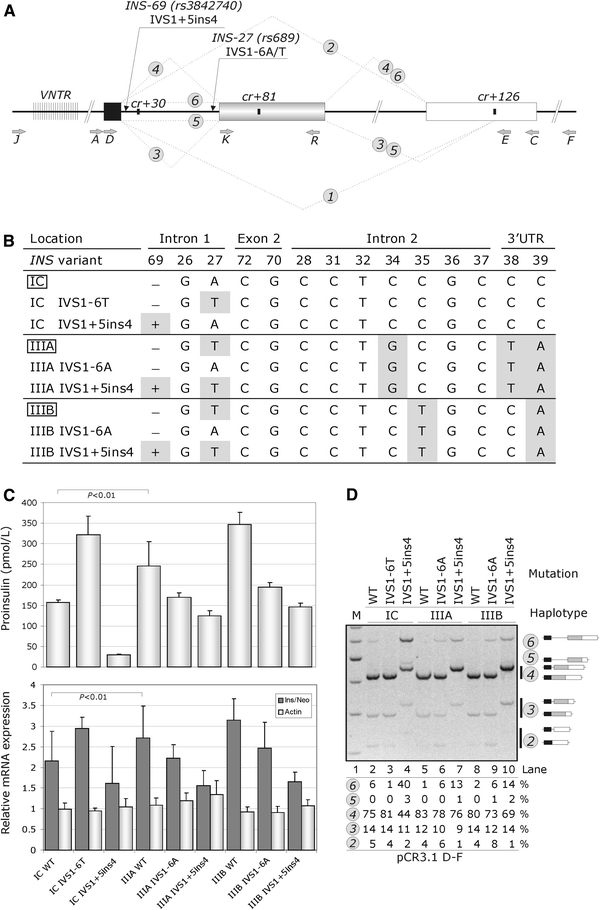
Haplotype-dependent proinsulin expression is determined by INS variants in intron 1. a INS splicing and reporter constructs. Exons 1, 2 and 3 are shown as black, grey and white boxes, respectively. Thick lines denote introns, dotted lines represent mRNA isoforms (numbered in circles). Primers and the most important gene variants are shown by grey and black arrows, respectively. The VNTR is denoted by closely spaced vertical lines. Cryptic splice sites are shown as black rectangles. b The INS haplotype structure and corresponding wild-type (boxed) and mutated reporter constructs. Variant nucleotides are highlighted. Designation of INS variants and haplotypes is as described (Stead et al. 2003); IVS intervening sequence or intron. c Haplotype-dependent proinsulin expression (upper panel) and corresponding relative mRNA levels (lower panel). The mean ratios of INS mRNA to RNA transcribed from the vector neomycin gene (neo) are shown as dark grey bars; the relative expression of endogenous β-actin is shown as light grey bars. Error bars represent s.d. d Splicing pattern of the INS reporter constructs. M 100-nt size marker. RNA isoforms are shown schematically to the right and are also numbered as in a . Percentage of splicing of each isoform is shown at the bottom, except for isoform 1 (expressed at <1%). Amplification was with primers PL3 (Kralovicova et al. 2006a) and E