
Fig. 4.
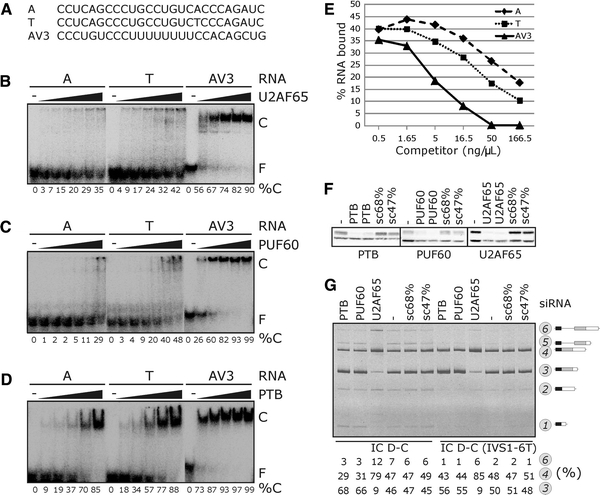
Interaction of poly(Y)-binding proteins with allele-specific INS transcripts. a Oligoribonucleotides representing IVS1-6A and IVS1-6T alleles and a control (AV3) used in gel shift experiments shown in b–d . b Concentration of recombinant U2AF65 was 0.14, 0.28, 0.56, 1.12, 2.24 and 4.48 μM. C, protein-RNA complex; F, free probe; %C, % bound. c Concentration of recombinant PUF60 was 0.34, 0.68, 1.36, 2.72, 5.44 and 10.88 μM. d Concentration of recombinant PTB was 0.32, 0.64, 1.28, 2.56 and 5.12 μM. e Example of a competition experiment with PUF60, 32P-labeled T probe and increasing concentrations of unlabeled competitors. f Western blot analysis of 293T cells transfected with siRNAs shown at the top (in duplicate); antibodies are shown at the bottom. The lower band corresponds to β-tubulin in each panel. sc, scrambled control siRNAs with the indicated GC content. g Opposite effects of U2AF65 and PUF60/PTB on intron 1 retention and activation of cryptic 3′ss +126. siRNAs (100 nM each) are at the top, reporters are at the bottom, spliced products to the right