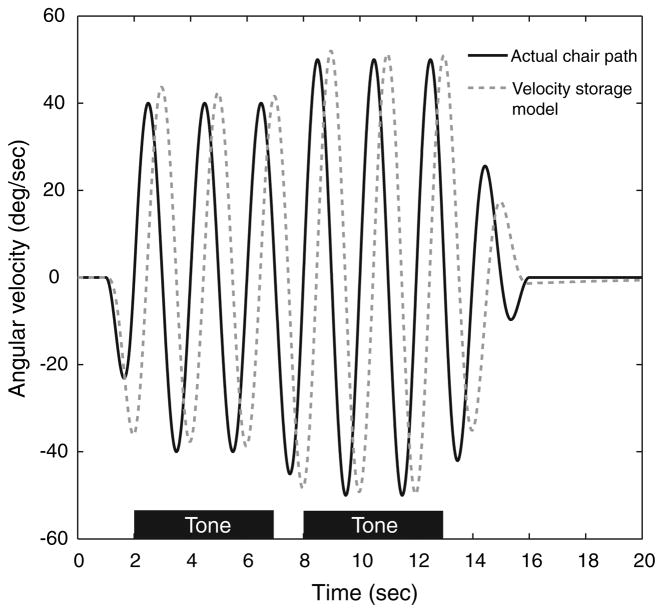
Fig. 1.
Stimulus paradigm. The angular velocity of the chair about an earth-vertical axis is shown in black. Two sequential intervals are presented, one at a reference peak velocity (here, 40 deg/s) and one at a comparison velocity somewhat higher than the reference velocity (here, 50 deg/s). The subject is cued with tones (black bars) to indicate the testing intervals and answers which of the two intervals is “faster.” The order of the reference and comparison velocities are randomized. The estimated velocity storage signal is shown as a gray dashed line. The peak amplitude of the estimated velocity storage signal is nearly equal to the peak stimulus velocity and extinguishes rapidly at the end of the stimulus

