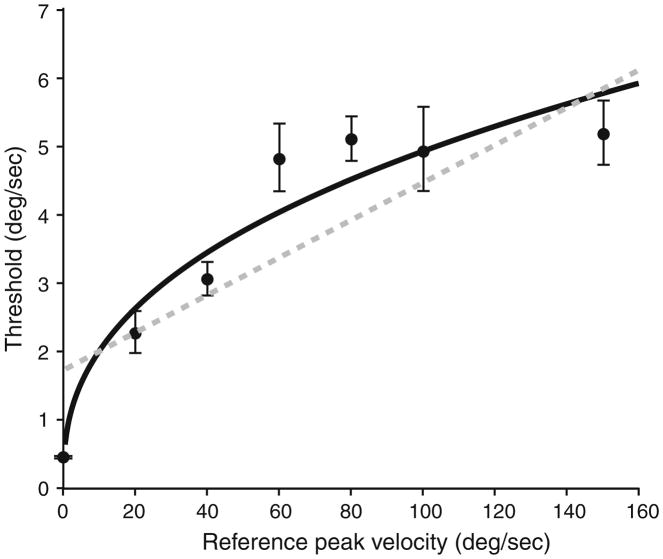
Fig. 4.
Fits to discrimination thresholds plotted as a function of reference velocity (filled circles). Plotted points represent values determined using the adaptive paradigm. A power function (black line) fits the data according to the formula ΔI = 0.88I0.37 (r2 = 0.88). A first-order polynomial (gray dashed line) is a poorer fit to the data according to the formula ΔI = 0.03.I + 1.72 (r2 = 0.69)

