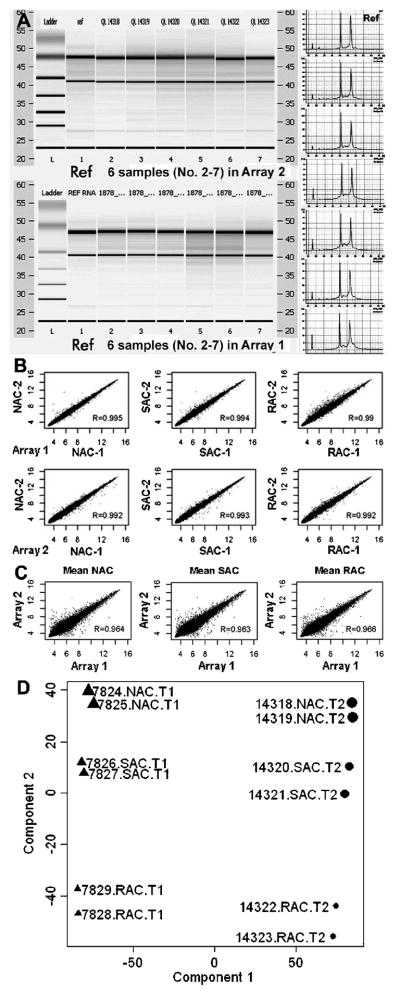
Figure 1.
Quality of RNA samples and data reproducibility of Affymetrix microarrays. A. The total RNA samples were analyzed by Agilent Bioanalyer 2100 with Biochips and gel electrophoresis using a referent RNA as a quality control; B. The scatter plots showed that the expression values of all genes transcripts from each cell population (NAC, SAC or RAC) were highly correlated between the duplicate chips with high correlation coefficients (R>0.99); C. The scatter plots showed the data reproducibility between the two separate arrays (R>0.96); D. Principal components analysis (PCA) on the entire data sets (the 12 samples’ ID showed) from 2 arrays showed well separated gene expression patterns of 3 isolated cell populations, RAC, SAC, and NAC.

