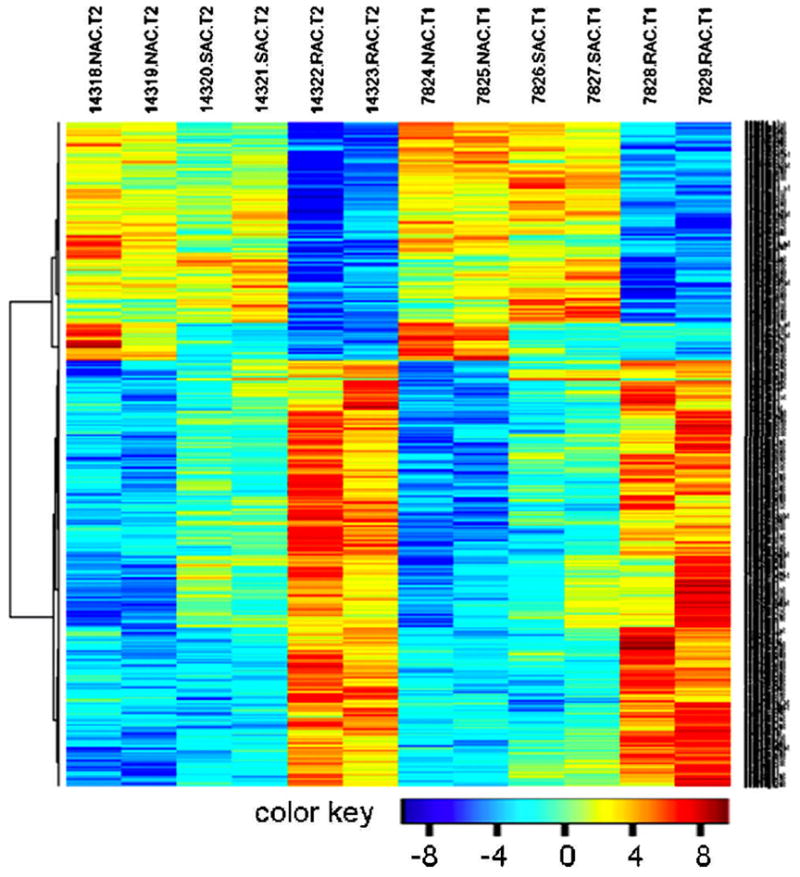
Figure 2.

Heat map visualization of 776 significantly regulated probe sets. A hierarchical clustering was analyzed on the probe sets consisting of the 776 genes including 499 up- and 277 down-regulated gene transcripts, which were selected from 12 chips in 2 arrays (T1 and T2) through a filter criteria of at least 2-fold changes with P≤0.05 (F test). Columns: samples; Rows: genes; Color key indicates gene expression value, blue: Lowest, red: highest.
