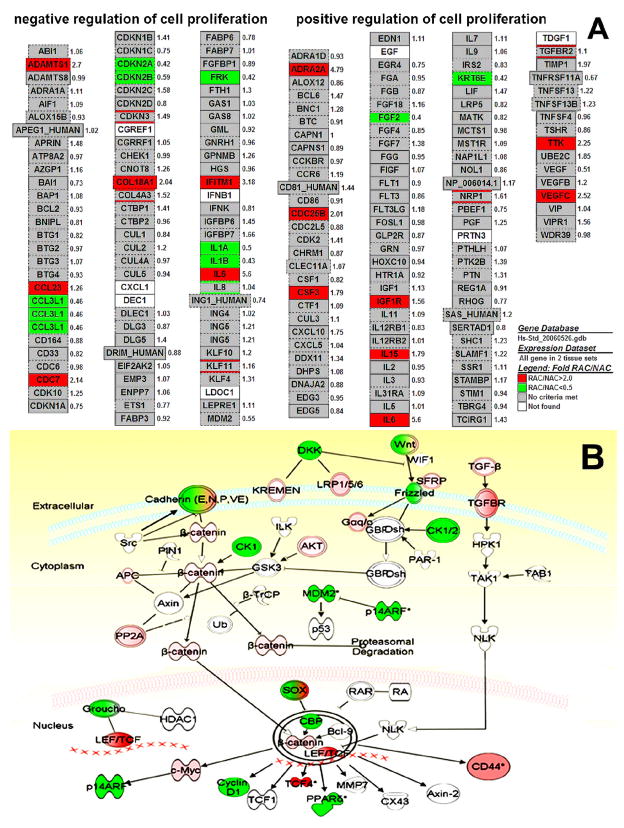
Figure 4.
Gene map examples of enriched biological pathways by RAC progenitors. A. Gene map of cell proliferation profile, generated by GenMAPP and MAPPFinder software, displayed numerous genes up (red)- or down (green)-regulated (fold changes of mRNA levels of RAC/NAC) in RAC population with their potential role in positive or negative regulation of cell proliferation. Grey color indicates not significantly changed (fold change of RAC/NAC < 2 or > 0.5, or P>00.05). White indicates absent genes by RAC population. B. Gene map of Wnt/β-catenin pathway, analyzed by the Ingenuity Pathway Analysis suite, showed that the numerous significantly regulated, up (red) or down (green), genes (fold change more than 1.5 fold with P value ≤0.05) in RAC population were involved in Wnt/β-catenin pathway. White indicates absent or unchanged genes by RAC population.

