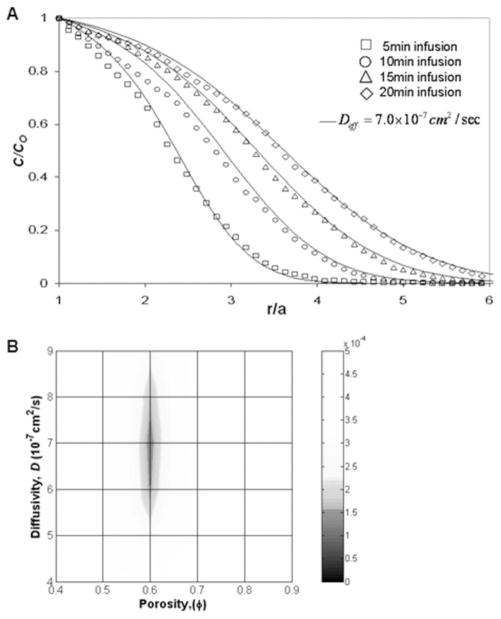
Figure 9.
Diffusivity of EBA. (A) Experimental concentration profiles versus integrated concentration profiles for EBA infusions into 1.0% hydrogels. Average experimental (points) and computational concentration profiles (lines) are plotted with the distance from the infusion point. Simulated profiles use best fit parameters obtained by minimization of the MSE function. C/Co is the normalized EBA concentration, and a is the outer diameter of the infusion cannula (a = 0.25 mm). (B) MSE map comparing the experimental EBA distribution data with numerical porous medium solutions. φ was estimated to be 0.6, and EBA diffusivity was estimated to be 7.0 × 10⁻⁷ cm2/s for 1.0 < R/a < 6.

