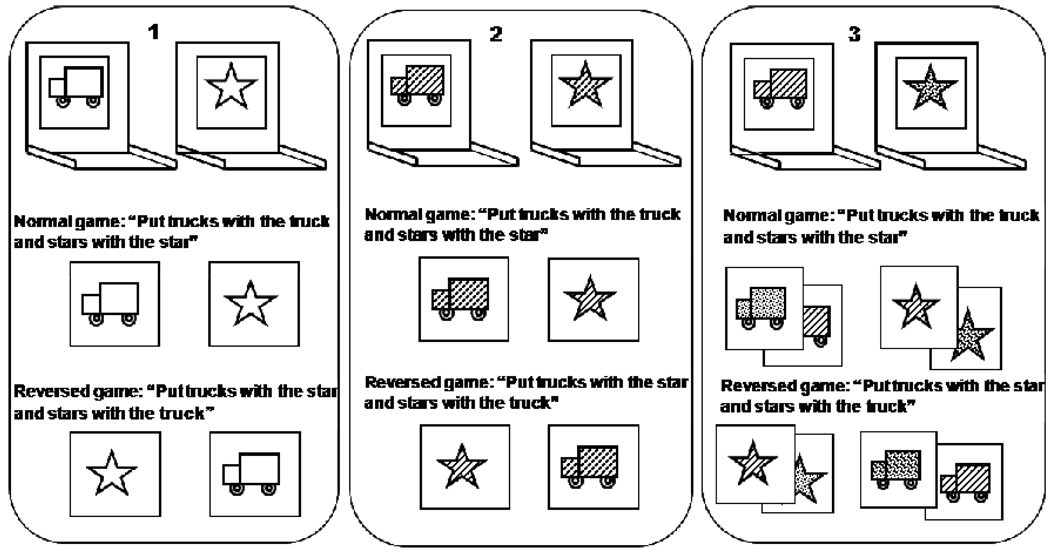
Figure 2.
The structure of three experiments manipulating the number of varying dimensions (all illustrated as red and blue, trucks and stars for ease of comparison). Only one dimension--shape--is relevant throughout; responses are reversed postswitch without changing the relevant dimension. Panel 1: black/white line-drawings (Brooks et al, 2003, exp 1); Panel 2: single-color line-drawings (Perner and Lang, 2002, reversal shift); and Panel 3: line-drawings with irrelevant color variation (Brooks et al, 2003, exp 2). Note: white indicates no color; stripes indicate red; dots indicate blue.

