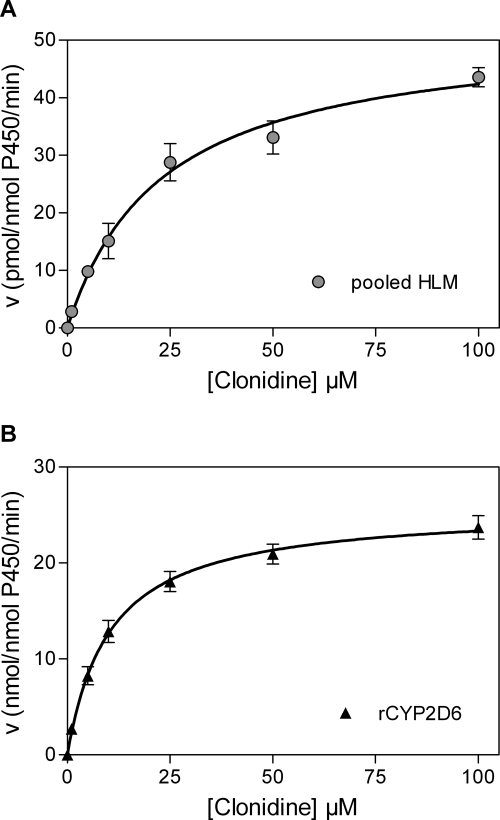
Fig. 1.
Saturation curves of clonidine 4-hydroxylation versus substrate concentration in pooled HLM (A) and recombinant CYP2D6 (B). Materials and Methods provides detailed assay information. Data points correspond to the mean ± S.D. of quadruplicate determinations in a single experiment. Activity expressed as pmol/nmol P450/min (A) or nmol/nmol P450/min (B).

