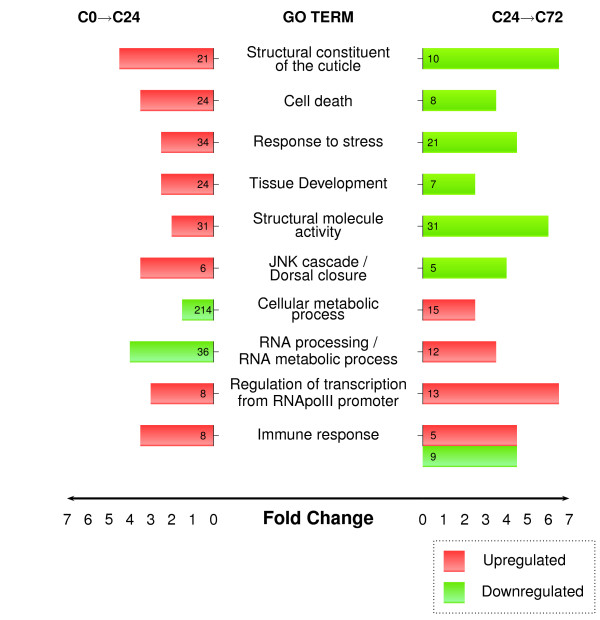
Figure 2.
Functional annotation of differentially expressed genes in wing imaginal discs at 24 and 72 hours of regeneration. Gene ontology annotation of upregulated (red) or downregulated (green) genes. The number of genes in each category in the microarrays is shown within the bars. The length of the bars indicates the fold change (enrichment in these transcriptomes compared to the whole genome, P value < 0.001 in all cases).

