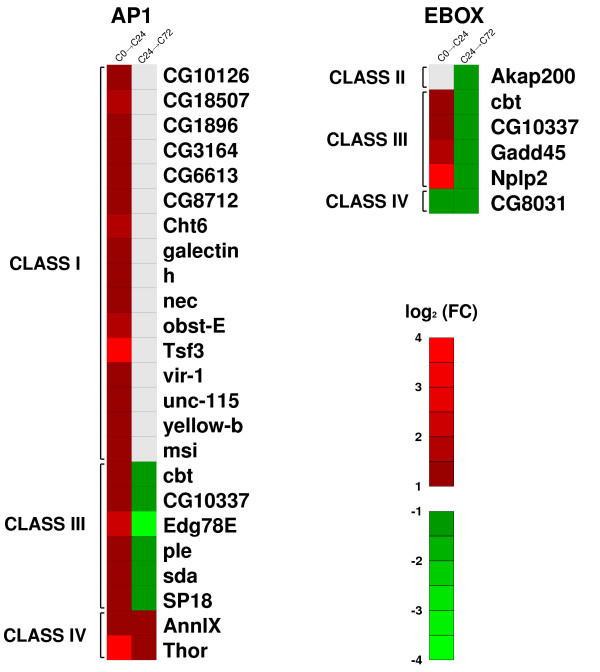
Figure 6.
Genes containing putative transcription factor binding sites. Expression maps of genes of different classes containing putative consensus sites for AP1 and E-boxes. For each microarray (C0→C24 and C24→C72), upregulated genes are shown in red, downregulated genes in green and genes with no differential expression in grey. On the left, genes in C0→C24 with AP1 binding sites in the promoter region. On the right, genes in C24→C72 containing E-boxes.

