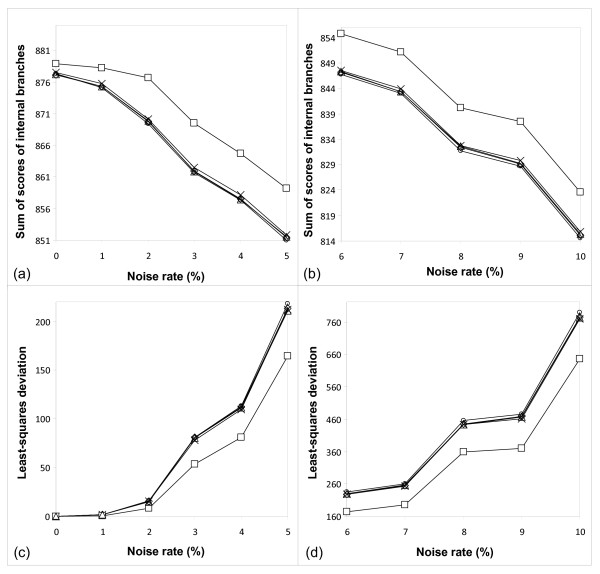
Figure 7.
Sum of bootstrap scores and LS deviation for the Primate data set. Sum of bootstrap scores of internal branches (cases a and b) and least-squares bootstrap deviation (cases c and d), computed according to Formula 14, for the Primate data set [15] obtained by the five bootstrapping strategies considered in this study. The results are shown with respect to the noise level (the noise percentage varying from 1 to 10% is represented on the x-axis). Standard bootstrap scores are depicted by circles, secondary bootstrap scores by crosses, LS-based bootstrap scores by diamonds, normalized secondary bootstrap scores by squares, and normalized LS-based bootstrap scores by triangles.

