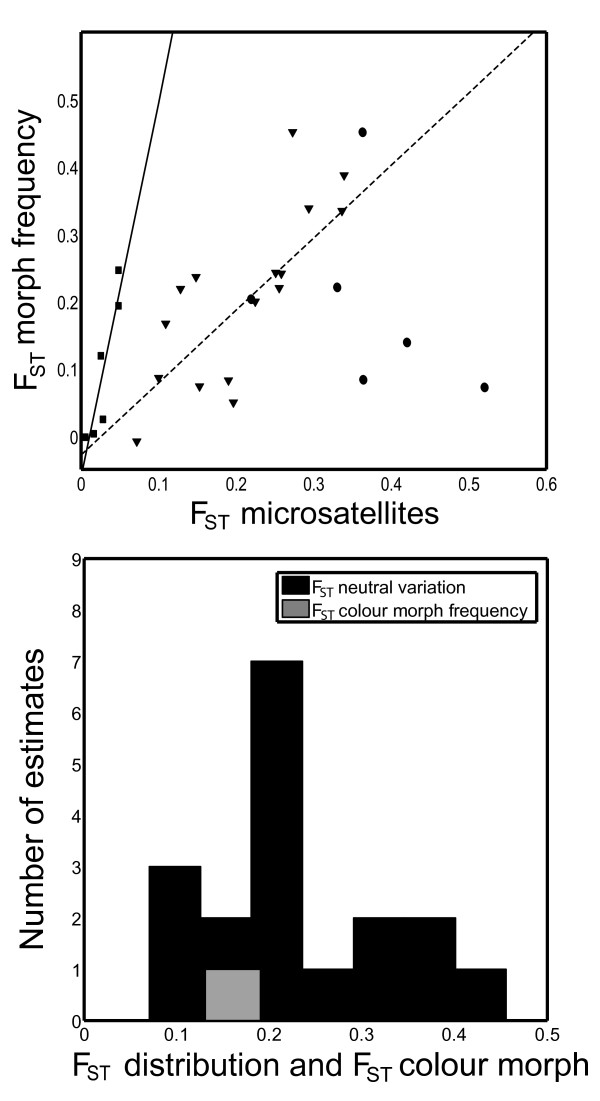
Figure 6.
Relationship between neutral divergence and morph divergence. (A) Relationship between the pair wise population comparisons (FST) calculated from color morph frequencies (assuming a single locus character) and neutral genetic divergence (FST obtained from 18 microsatellite loci). The relationship is positive and statistically significant when data from all categories are included: y = 0.09 + 0.44*x; r2 = 0.20; F = 6.37; df = 1, 26; P = 0.02. There is also a significant relationship when only the mainland populations are included (squares; full line; y = -0.07 + 5.59*x; r2 = 0.83; F = 19.41; df = 1, 4; P = 0.01) and when only mainland-island comparisons are included (triangles; dashed line; y = -0.04 + 1.19*x; r2 = 0.60; F = 21.01; df = 1, 14; P = 0.0004). There is no significant relationship between color morph divergence and neutral divergence when only island populations are compared (dots). (B) Distribution of mean pair wise FST-values for the 18 microsatellite loci (black) and the mean pair wise FST-values that were calculated from the throat color morph frequencies (assuming a single locus character; (in white)).

