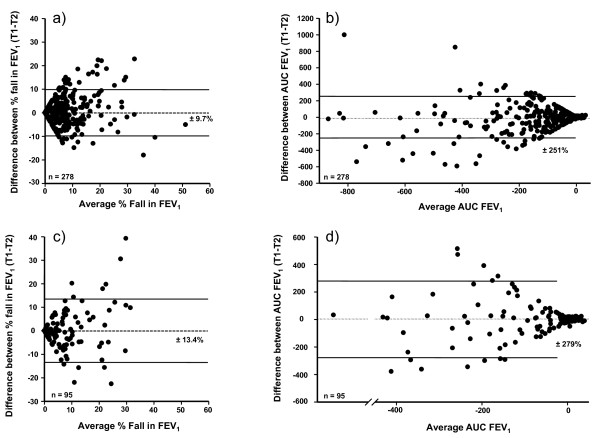
Figure 2.
Reproducibility of the % fall in FEV1 and area under the FEV1 curve following exercise. The difference between values for % fall FEV1 and AUC0-30 min % fall FEV1 per min on the two exercise challenges in relation to the average value for the two challenges in adults (a and b) and children (c and d). The interval defines the 95% probability that the difference between a single measurement and the true value for the subject is within that range.

