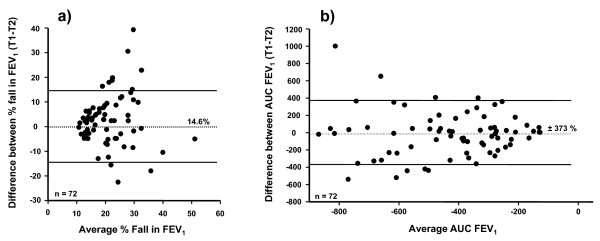
Figure 3.
Reproducibility of the % fall in FEV1 and area under the FEV1 curve following exercise in subjects positive on both occasions. The difference between values for a) % fall in FEV1; and b) AUC0-30 min on the two challenges in relation to the average value on the two challenges for those who had a fall in FEV1 ≥10% on both challenges. The interval defines the 95% probability that the difference between a single measurement and the true value for the subject is within that range.

