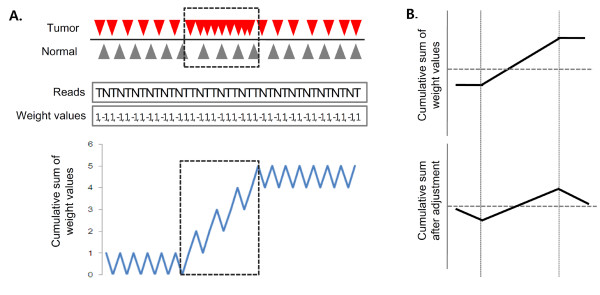
Figure 1.
A schematic of the algorithm. (A) The sequencing reads for tumor (red triangles) and matched normal genomes (black triangles) are shown. The reads are ordered according to their chromosomal location and converted into a one-dimensional array for pattern detection. Tumor (T) and normal (N) reads are given the weight values WT and WN, respectively (in this example, +1 and -1 for simplicity). The cumulative sum of weight values shows an upward slope (indicated by the box) for a region of local copy number gain (prevalence of tumor reads over normal reads). (B) The upward slope in the cumulative sum and the flanking flat lines correspond to a local copy number gain and regions of no copy number change, respectively (top). For improved performance, the threshold t is subtracted from weight values to give a negative slope to regions of no copy number differences while maintaining the positive slope for the copy number gain (bottom).

