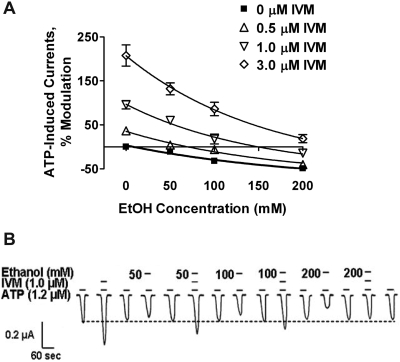
Fig. 4.
IVM right-shifts the ethanol concentration–response curve. A, the effects of ethanol (50–200 mM) and IVM (0.5–3 μM) alone and in combination on ATP-gated currents in P2X4Rs. Data are presented as mean ± S.E.M. of 5 to 10 oocytes per data point. B, representative tracings showing modulation of ATP-induced currents by individual applications of IVM (1 μM) and ethanol (50, 100, and 200 mM) and the antagonistic effect of IVM on ethanol inhibition during their combined action. Horizontal short bars above the currents depict ATP or drug applications. Numbers next to the short bars represent ethanol concentrations. Dotted line represents the baseline responses for ATP.

