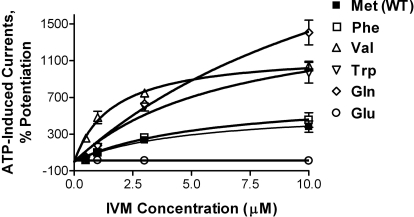
Fig. 7.
Mutations at position 336 change the sensitivity of P2X4Rs to modulation by IVM. IVM (0.5–10 μM) concentration–response curves for WT and mutant P2X4Rs at position 336 are shown. Data were produced by using ATP EC10-induced currents and are presented as mean ± S.E.M. of 3 to 12 oocytes per data point. The ATP EC10 values for WT and mutant receptors are presented in Table 2.

