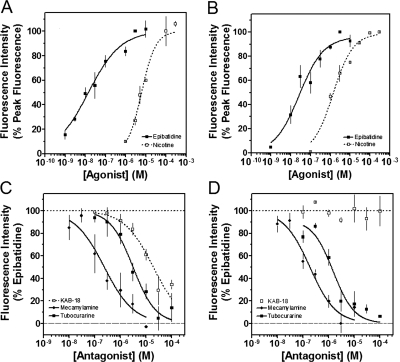
Fig. 1.
Concentration–response effects of agonists, antagonists, and KAB-18 on Hα4β2 and Hα3β4 nAChRs. A and B, the concentration–response effects of nicotine (□) and epibatidine (■) were investigated by using HEK ts201 cells expressing Hα4β2 and Hα3β4 nAChRs. Data are expressed as a percentage of peak fluorescence responses for either 3 μM epibatidine (epibatidine curves) or 100 μM nicotine (nicotine curves). C and D, tubocurarine (■), mecamylamine (♦), and KAB-18 (□) were investigated by using HEK ts201 cells expressing Hα4β2 and Hα3β4 nAChRs. Epibatidine (3 μM) was used as the agonist, and data are expressed as a percentage of peak fluorescence responses for 3 μM epibatidine. The dotted and dashed horizontal lines show the 100% control response and 100% inhibition, respectively. Values represent means ± S.E.M.s (n = 4–10).

