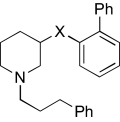
TABLE 5.
Region 4 SAR studies
 |
X | Hα4β2 nAChRs |
Hα3β4 nAChRs |
||
|---|---|---|---|---|---|
| IC50 Value (μM)a | nH | IC50 Value (μM)a | nH | ||
| KAB-18 |  |
13.5 (9.7–18.5) | −0.7 | NAc | |
| DDR-5 |  |
19.8 (8.3–47.1) | −0.8 | NAc | |
| DDR-3 |  |
16.6 (9.7–28.6) | −0.9 | 14.5 (4.9–43.1) | −0.7 |
| JHB-9 |  |
17.6 (11.6–26.8) | −0.9 | 10.2 (3.4–30.5) | −0.9 |
| APB-21 | 12.6 (3.0–53.8) | −0.8 | 15.5 (8.4–29.0) | −0.9 | |
| DDR-14 |  |
6.4 (4.1–10.4) | −1.1 | 2.7 (0.4–17.9) | −1.2 |
nH, Hill coefficient; NA, no activity at concentrations up to 100 μM.
Values represent geometric means (confidence limits), n = 4–8.
