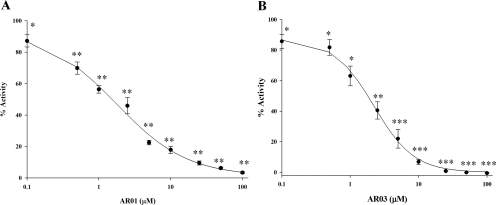
Fig. 2.
Calculation of the IC50 values of the AR01 and AR03 compounds. IC50 values of the top hit compounds were determined using the HTS assay. A range of concentrations of each of the compounds were tested with 0.35 nM Ape1. The percentage of inhibition of Ape1's activity was calculated using the rates of reaction for each of the concentrations of the compounds compared against the percentage of activity of Ape1 alone. The assays for each compound were performed three individual times. SigmaPlot software (see equation described under Materials and Methods) was used to calculate the values, and they are presented here is a semilog plot of the IC50 value determination. A,IC50 value curve for AR01. B, IC50 value curve for AR03. The p values were calculated using the Student's t test comparing lanes with inhibitor with lane with no inhibitor (DMSO), *, p ≤ 0.03; **, p ≤ 0.0005; and ***, p ≤ 0.0001.

