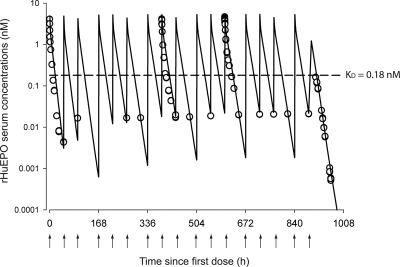
Fig. 2.
Time course profiles of rHuEPO serum concentrations after multiple intravenous injections of 1350 IU/kg thrice weekly for 6 weeks. The observed data are represented by ○, and the lines represent the model predictions using eq. 4. The arrows represent intravenous dosing events.

