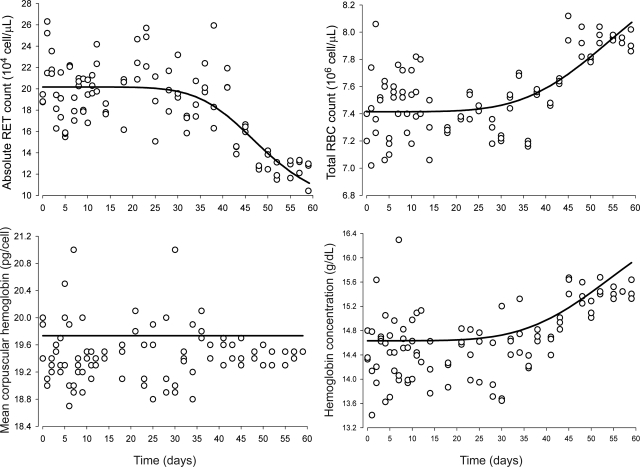
Fig. 5.
Changes in baselines values of absolute blood reticulocyte counts (top left), red blood cells (top right), mean corpuscular hemoglobin (bottom left), and hemoglobin (bottom right). The observed data are represented by ○, and the lines represent the model predictions using eq. 29 (top left), eq. 30 (top right), MCH baseline (bottom left), and eq. 28 (bottom right), respectively.

