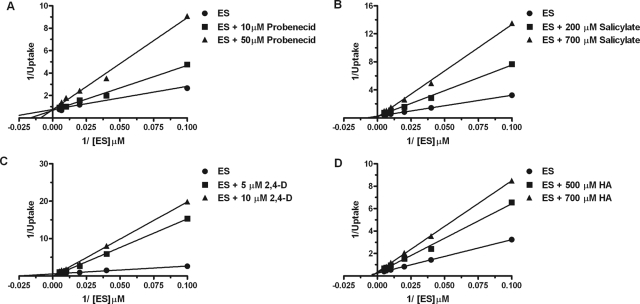
Fig. 2.
Competitive inhibition of mOat6-mediated transport. Two-minute cellular accumulation assays were performed with 10, 25, 50, 100, 150, and 200 μM [3H]ES in the absence and presence of varying concentrations of probenecid (A), salicylate (B), 2,4-D (C), and hippuric acid (D). Data were corrected for nonspecific background measured in the CHO-FRT (control) cells, and saturation curves were generated. Kinetic constant determination was done by using nonlinear regression analysis; however, Lineweaver-Burk transformations of the data are displayed to aid visualization of the mode of inhibition as competitive. Each experiment was repeated three times in triplicate. Data shown are mean values ± S.E. (n = 3) from a representative experiment.

