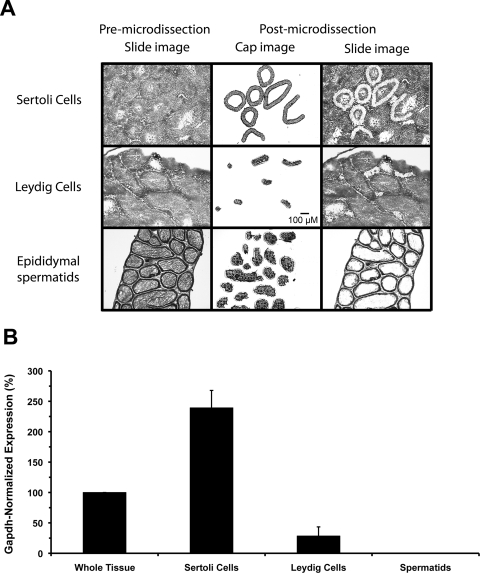
Fig. 6.
Laser capture microdissection and testicular expression of mOat6. Expression of Oat6 mRNA in different murine testicular cell types was examined by QPCR on samples isolated by LCM. A, histological images depicting the LCM process. The premicrodissection slide image shows individual ∼8-μm sections used for identification and capture of the desired cell types. Sertoli and Leydig cell populations were isolated from sections through the testis proper, whereas spermatids were harvested from sections of the epididymis. Epididymal spermatids were used to avoid potential cross-contamination with Sertoli cell fragments in spermatids isolated from the testis proper. The postmicrodissection cap image shows the various populations of cells isolated for QPCR analysis. The postmicrodissection slide image, compared with the premicrodissection slide image, shows where within each section the LCM samples were collected. All images are 10×. Scale bar, 100 μm. B, Oat6 mRNA expression levels in testicular cell types. Total RNA was purified from the cells isolated by LCM, and from whole testis, and reverse-transcribed. Gene expression levels of Oat6 and Gapdh were determined by using TaqMan chemistry and real-time QPCR. Oat6 signal (normalized to Gapdh expression) was readily detectable in intact testis, and this level was set to 100%. The Oat6 expression level in Sertoli cells (250%) was significantly higher than that detected in whole tissue. A few random Leydig cell replicates exhibited sporadic signal in the final cycles of a run. This was never a consistent result and never involved all sample replicates; thus this was interpreted to be the result of slight contamination with Sertoli cells during the LCM process and not as extremely low Leydig cell expression. No signal was ever detected in epididymal spermatids. Data are presented as mean values ± S.E. (n = 3 animals).

