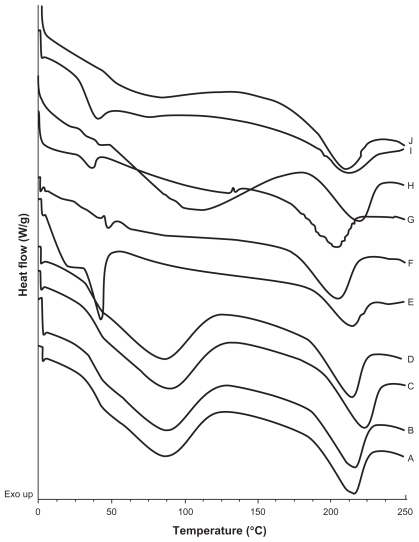
Figure 4.
DSC thermograms of A) and B) batches prepared with CyA only, t = 0 and t = 5 months respectively; C) and D) empty SLNs; t = 0 and t = 5 months respectively; E) and F) SLNs with 5% CyA (drug-lipid ratio 20:400 (w/w)), t = 0 and t = 5.5 months, respectively; G) and H) SLNs with 15% CyA (drug-lipid ratio 60:400 (w/w)), t = 0 and t = 5.5 months, respectively; I) and J) SLNs with 50% CyA (drug-lipid ratio 200:400 (w/w)), t = 0 and t = 5.5 months, respectively.

