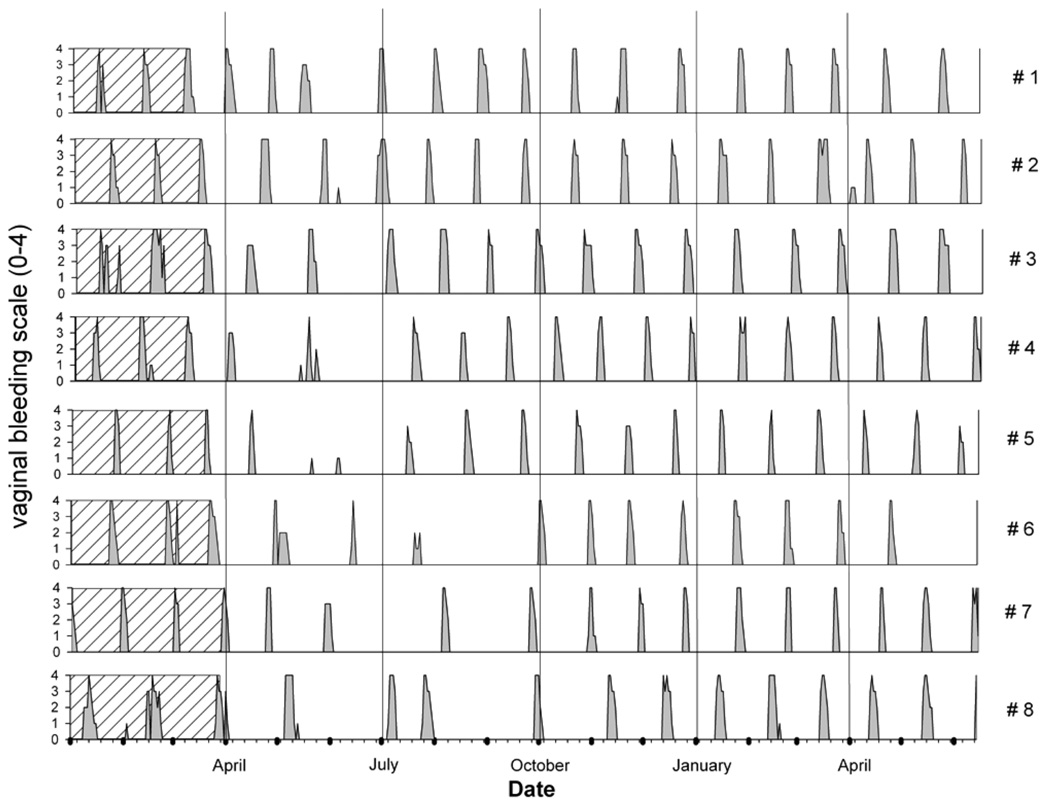
FIGURE 13.
Individual cyclicity pattern of eight cynomolgus monkeys throughout a period of approximately seventeen months (data were replotted from Figure 8). Animals were initially single housed (shaded area) and then co-housed as a group. Every plot represents one animal. The y-axis denotes the grading of vaginal smear evaluation. Note the absence of synchronization and seasonality and the transient irregularity/absence of cycling in some animals during group housing.

