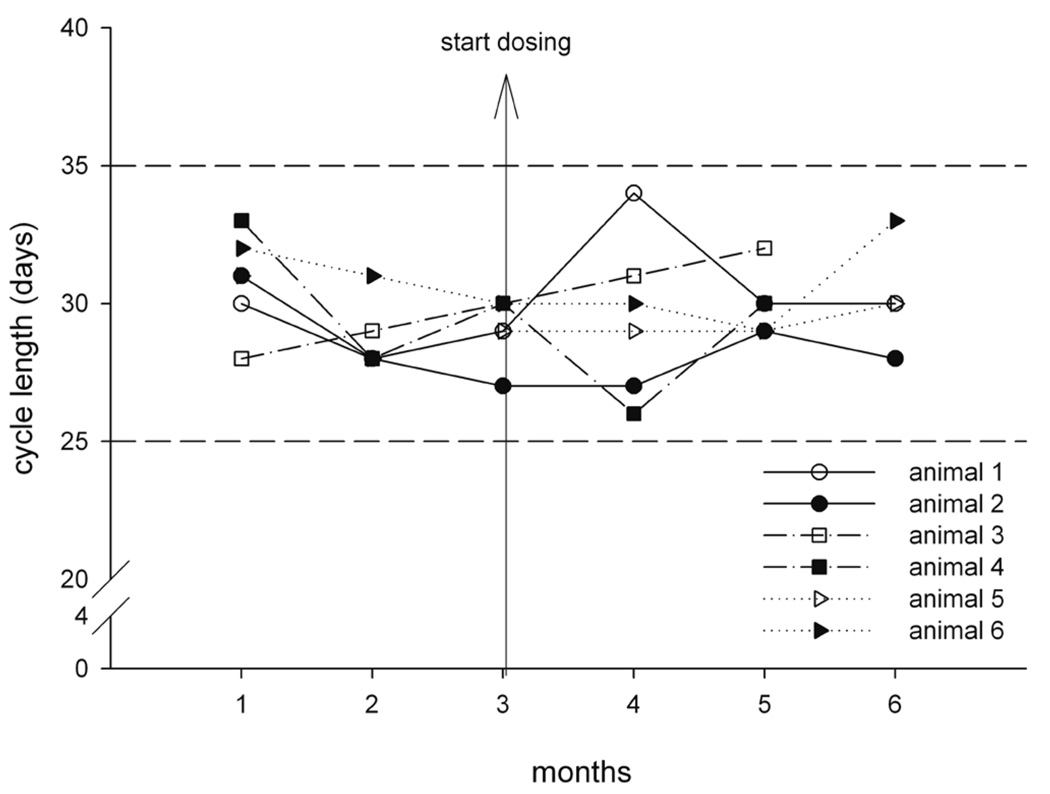
FIGURE 14.
Cycle duration before and during treatment in six cynomolgus monkeys housed in pairs (animal 1/animal 2, animal 3/animal 4, animal 5/animal 6). Prior to formation of pairs, the animals knew each other. Vertical arrow represents the onset of oral daily dosing of vehicle in a toxicity study. Dashed horizontal lines represent the upper and lower limits of spontaneous ovarian cycle duration. Note that cycle duration remained within normal limits for all animals.

