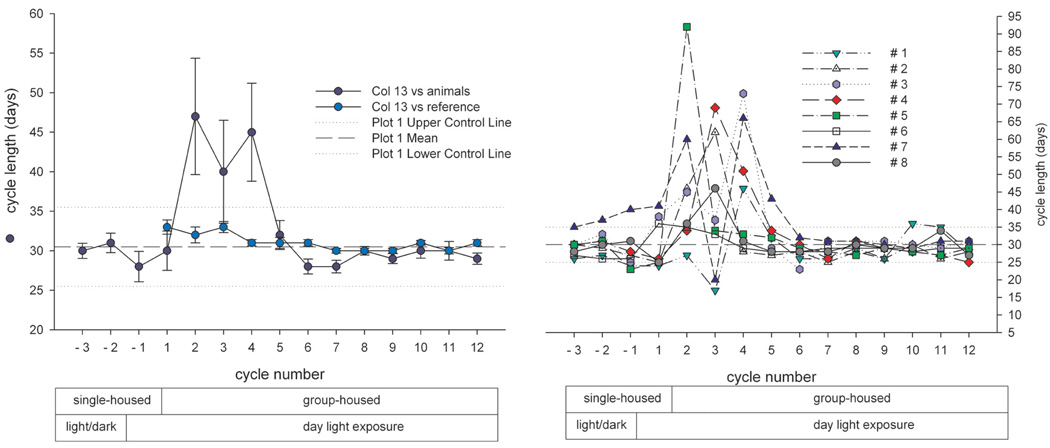
FIGURE 8.
Group mean cycle length (left panel) and individual menstrual-cycle length (right) from eight animals under individual and group-housing conditions. Data are M ± SD and are displayed in Figure 13 for every animal. The reference line (blue circles) in the left panel depicts the mean cycle duration in seventy-eight single-housed animals (M ± SD). Dotted lines indicate the normal variation (30.4 ± 4.7 days) of menstrual cycle length. Note the absence of seasonal variation in cycle duration. The right panel depicts the individual data for the eight individual animals. Note the increased variability and cycle duration after transition from single to group housing and the fact that these cycle irregularities were transient. Following approximately six cycles, ovarian cycle duration had returned to normal. The x-axis denotes the numbers of successive ovarian cycles. Negative cycles numbers are those prior to having all eight animals transferred into one group.

