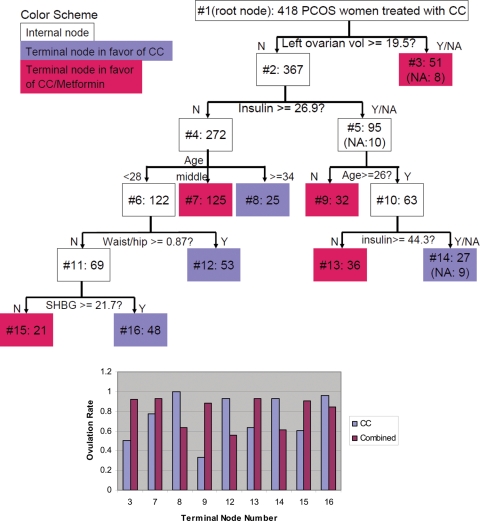
Figure 1.
A Classification Tree (top). The top box, labeled #1, is the root node containing the entire study sample of 418 PCOS women. It is partitioned into two nodes 2 and 3 in the next layer. The number of subjects is also displayed next to the node number inside each node. The splitting role is beneath the internal node. The value along an arrow is the cutoff of the splitting variable. When the splitting variable has missing values, the number of affected subjects is presented in the resulting node. In the bottom panel, the vertical bars (purple for CC and red for combination) display the success rates of ovulation within each terminal node, and the terminal node number is printed on the x-axis. Terminal nodes 3, 7, 9, 13 and 15 in the tree are colored red to indicate that the combined treatment is preferred, and other terminal nodes are colored purple indicating that CC is more successful.

