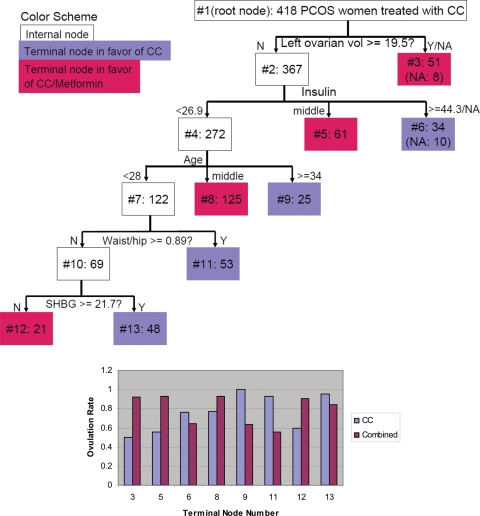
Figure 2.
A Revised Classification Tree (top). The top box, labeled #1, is the root node containing the entire study sample of 418 PCOS women. The number of subjects is also displayed next to the node number inside each node. The splitting role is beneath the internal node. The value along an arrow is the cutoff of the splitting variable. (For further details, see the legend for Fig. 1.)

