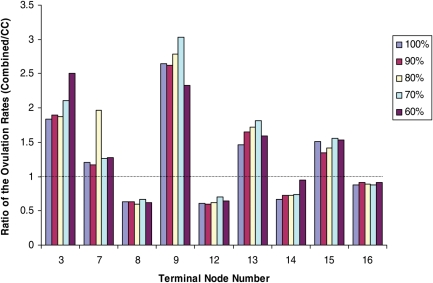
Figure 3.
Internal Validation of the Ratio of the Ovulation Rates between the combined and CC treatment groups. The ratios are presented by the terminal nodes in Fig. 1. We took a random 60, 70, 80, 90 and 100% of the samples to examine the trend in the within-node preferential treatment.

