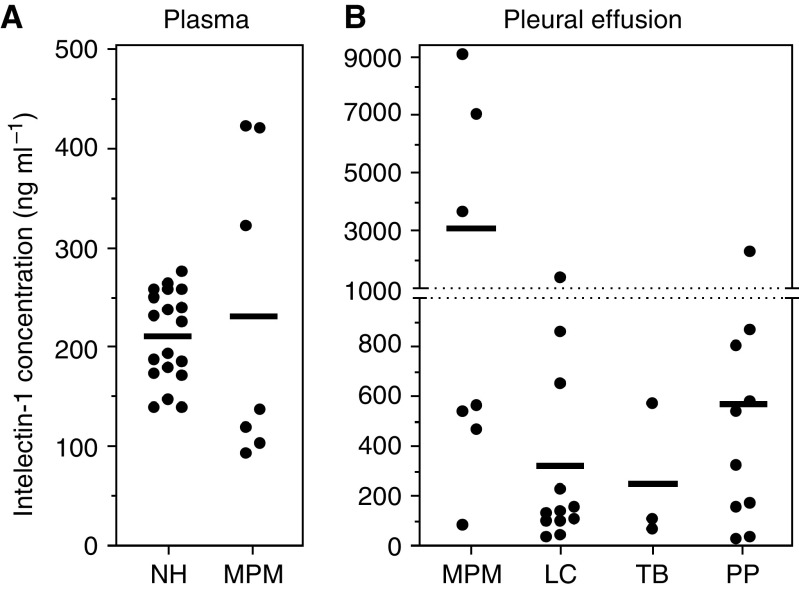
Figure 5.
Concentration of intelectin-1 in pleural effusion and plasma. Intelectin-1 concentration was measured by sandwich ELISA as described in the Materials and Methods. Values represent the mean of duplicate determinations. The bold horizontal bar is the mean value of each sample. (A) Intelectin-1 concentration in heparinised plasmas of normal healthy donors (NH) or MPM patients (MPM). (B) Intelectin-1 concentration in heparinised pleural effusions of patients with MPM (MPM), lung cancer (LC), tuberculosis (TB), and pleuropneumonia (PP). Lung cancer contains 9 adenocarcinomas, 2 small cell carcinomas (intelectin-1 concentration, 1359 and 98 ng ml−1), and 1 large cell carcinoma (intelectin-1 concentration, 222 ng ml−1). Differences in mean values were evaluated by permutation tests. The P-value between MPM and LC was 0.0117. The P-value between MPM and PP was 0.0306.

