Fig. 5.
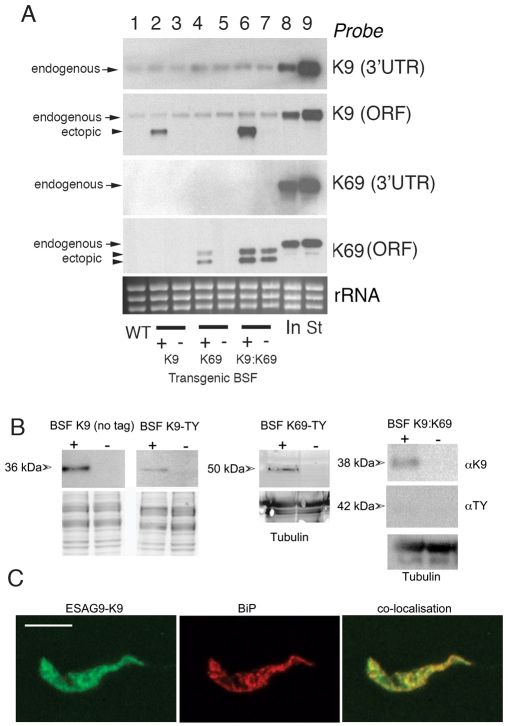
Secretion of ESAG9 proteins. (A) Northern blots of the mRNA levels of ESAG-K9 (no tag) and ESAG9-K69-Ty in transgenic T. brucei s427 monomorphic forms. In each case probes were used that detected either the endogenous ESAG9 transcript only (this being directed to the 3′UTR missing in the transgenes) or to the open reading frame (ORF; detecting both the endogenous and ectopically expressed copy). The gene for ESAG9-K9 is present in T. brucei s427 and the low level expression of this gene is detected in the monomorphic slender forms. By contrast, the gene for ESAG9-K69 is absent from the T. brucei s427 genome and no endogenous transcript is detected. The respective levels of ESAG9-K9 and ESAG9-K69 are also shown in early intermediate (In) and stumpy (St) forms of T. brucei EATRO 2340 (lanes 8, 9). Tetracycline-inducible expression of ESAG9-K9 (lanes 2, 3), ESAG9-K69 (lane 4,5) and both ESAG9-K9 and K69 is detected in the single and double expresser lines, though the ESAG-K69 transgene expression is leaky in the double expresser. The ESAG9-K69 generates two mRNAs believed to represent the use of alternative polyadenylation sites in the expression construct. (B) Ectopic expression of ESAG9-K9 (no tag, or Ty-tagged) and of ESAG9-K69, or both proteins, in monomorphic bloodstream forms of T. brucei. Protein samples were derived from cells harvested after 48 hours with (+) or without (−) tetracycline (to induce transgene expression) and probed for expression of each protein using either ESAG9-K9-specific antiserum (K9-no tag samples and BSF K9:K69) or the Ty1-specific antibody, BB2. Relative loading was verified by Coomassie Blue staining or reaction with antibody to α-tubulin. In the BSF K9:K69 cell line, ESAG9-K69 expression was barely detectable due to its extracellular release (see Fig. 7). (C) Colocalisation of Ty-tagged ESAG9-K9 in BSF K9-Ty cells with an ER marker, BIP. The localisation of ESAG9-K9 (left) (detected using the BB2 antibody) and BIP (centre) were analysed using confocal microscopy. In the overlaid image (right; yellow) extensive colocalisation was evident. Scale bar: 15 μm.

