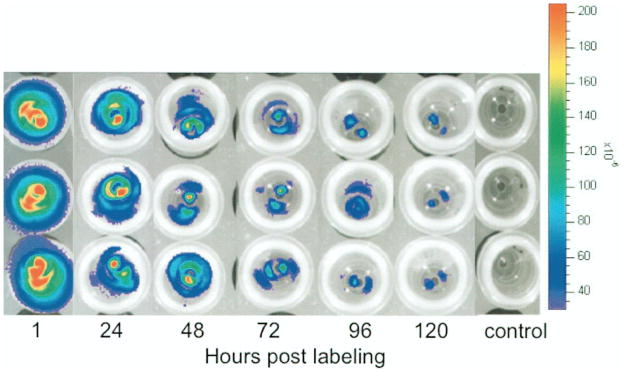
Figure 3.
Representative optical images of ICG-labeled hESCs in 1 ml of KSR using the optimized labeling protocol (2.0 mg ICG/ml, 60-min incubation) at different time points after labeling (1, 24, 48, 72, 96, and 120 h) showing decreasing fluorescent signal over time. The three rows represent triplicates.

