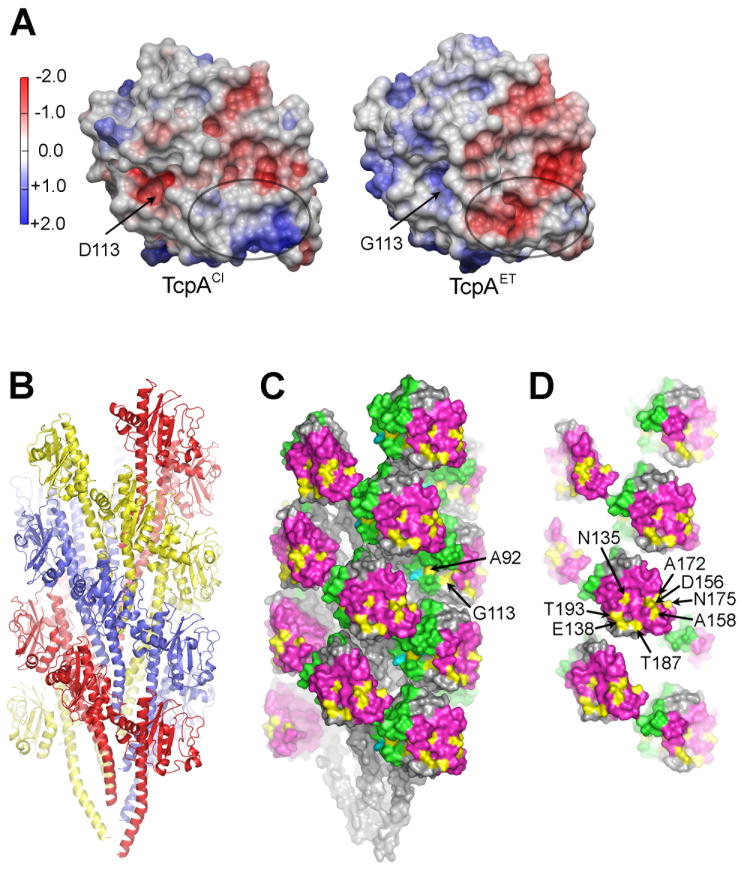
Fig. 3. TcpA electrostatic surface and El Tor TCP filament model.
(A) Comparison of the electrostatic surfaces of ΔN-TcpACl and ΔN-TcpAET. The orientation is similar to that shown in Fig. 2C. The electrostatic surface differs in the D-region patch (circled) where there are six non-conserved amino acid differences between the two proteins, each resulting in a change (gain or loss) of a single charge. A second difference is in the location of an aspartate→glycine change at residue 113. (B) Side view of the El Tor TCP filament model generated by superimposing ΔN-TcpAET onto TcpACl in the classical TCP model (Li et al., 2008). The filament is colored to show the subunits arranged in a left-handed three-start helix. (C) Space-filling representation of El Tor TCP to show the positions of the non-conserved amino acids (yellow) in the cavities of the filament and (D) on the protruding D-region. The αβ-loop is colored green and the D-region is magenta in (C) and (D). D-region residues 138, 156, 158, 172, 175 and 187 were selected for classical-to-El Tor mutations, as was cavity residue 113.

