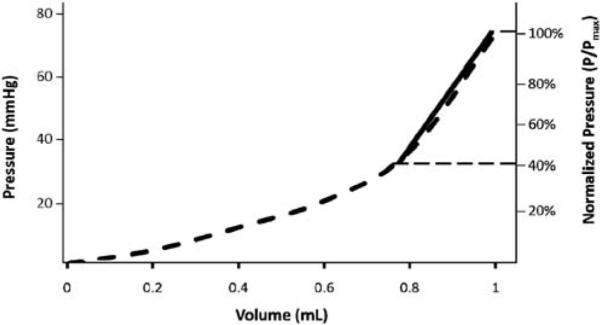
Fig. 3.

Calculation of the vaginal distensibility in a virgin sample. Pressure (mmHg, left axis) was normalized to the maximum pressure of the curve (%, right axis). The curve was isolated from 40–100% of the maximum pressure as noted by the horizontal dashed lines. This area was fit with a line (solid line) whose slope represents vaginal distensibility
