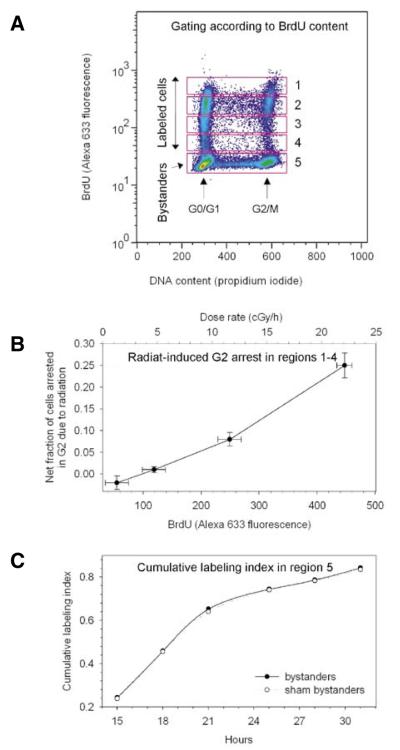
Figure 4. Quantitative relationship between bromodeoxyuridine (BrdU) immunostaining and activation of a radiation-induced G2 checkpoint.
(A) Contour plot of BrdU (Alexa Fluor 633 fluorescence) versus DNA content (propidium iodide). Five regions are identified according to BrdU− immunofluorescence intensity. (B) Events from regions 1–4 were gated out and examined for the onset of a G2 checkpoint as function of mean dose rate to labeled cells. Error bars represent one standard deviation. (C) The a flow cytometric-cumulative labeling index (FCM-CLI) assay was run on unlabeled bystander cells (gated in region 5, panel A) to measure activation of the G1 checkpoint, relative to shamlabeling conditions. The two datasets were fitted to a sigmoid model function and their similarity statistically compared with an F-test (P value 0.99; Origin® 7.5 software; RockWare, Golden, CO, USA). Data for one of two replicate experiments is shown.

